1. Data Engineering Described
Let's clarify why we are here.
Definition of Data Engineer 🤨
Who is a data engineer? What do they do?
Here is Joe's and Matt's definition:
Data engineering is the development, implementation, and maintenance of systems and processes that take in raw data and produce high-quality, consistent information that supports downstream use cases, such as analysis and machine learning.
Data engineering is the intersection of security, data management, DataOps, data architecture, orchestration, and software engineering. A data engineer manages the data engineering lifecycle, beginning with getting data from source systems and ending with serving data for use cases, such as analysis or machine learning.
If you do not understand these definitions fully, don't worry. 💕
Throughout the book, we will unpack this definition.
Data Engineering Lifecycle
The book is centered around an idea called the data engineering lifecycle, which gives data engineers the holistic context to view their role.
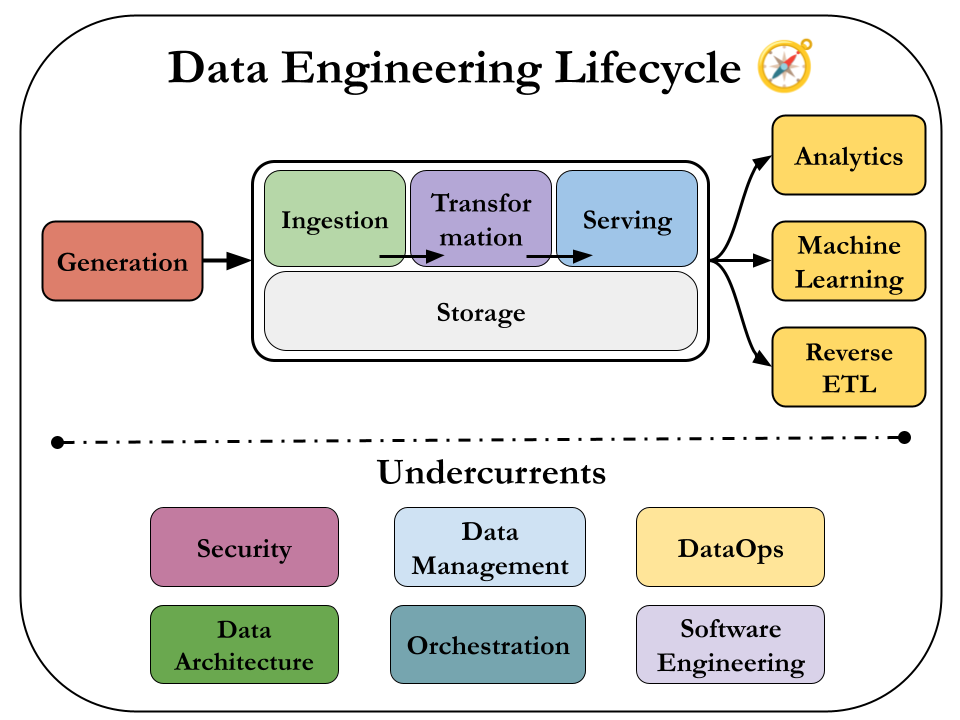
So we'll to dive deep in these 5 stages:
- Generation
- Storage
- Ingestion
- Transformation
- Serving
and consider the undercurrents of them.
I believe this is a fantastic way to see the field. It's free from any single technology and it helps us focus the end goal. 🥳
Evolution of the Data Engineer
This bit gives us a history for the Data Engineering field.
Most important points are:
- The birth of Data Warehousing (1989 - Bill Inmon) - first age of scalable analytics.
- Commodity hardware—such as servers, RAM and disks becoming cheaper.
- Distributed computation and storage on massive computing clusters becoming mainstream at a vast scale.
- Google File System and Apache Hadoop
- Cloud Compute and Storage becoming popular on AWS, Google Cloud and Microsoft Azure.
- Open source big data tools are rapidly spreading.
Data engineers managing the data engineering lifecycle have better tools and techniques than ever before. All we have to do is to master them. 😌
Data Hierarchy Of Needs
Another crucial idea to understand is the Data Hierarchy Of Needs:
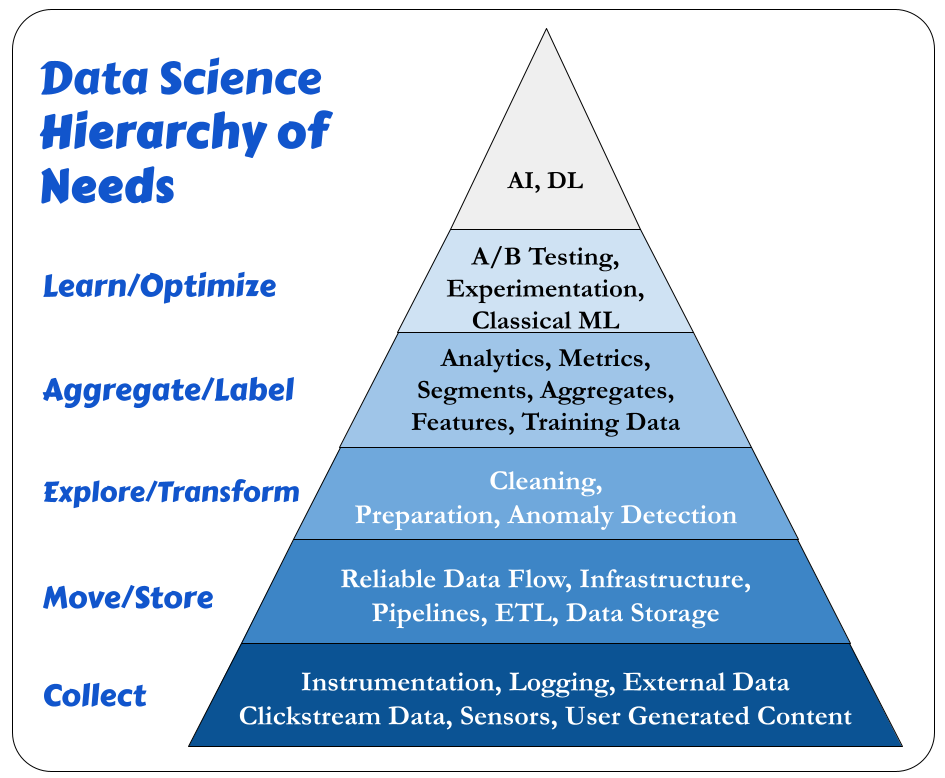
Special thanks to Monica Rogati.
We need a solid foundation for effective AI and ML.
Here is how I interpret this image:
Collect:
We gather the raw inputs that fuel all downstream data work.
Instrumentation
Instrumentation means embedding code or tools into applications & systems to collect data about usage or performance.
Examples:
- Adding tracking code (e.g., Google Analytics) to a website
- Emitting events like
button_clickorcheckout_start - Measuring server response times
📌 Goal: Make sure data is being captured from the start.
Logging
Logging is the automatic recording of system or application events — it's like keeping a diary of what the system is doing.
Examples:
- Web server logs recording IPs and endpoints hit
- Application logs showing errors or user actions
- API request logs
📌 Goal: Enable debugging, monitoring, and behavioral analysis.
External Data
This refers to data sourced from outside your system, like 3rd-party APIs or public datasets.
Examples:
- Weather data from a public API
- Economic indicators from government datasets
- Industry benchmarks from data providers
📌 Goal: Enrich internal data with external context.
Clickstream Data
Clickstream data tracks how users navigate through a website or app, capturing sequences of events.
Examples:
- Page views
- Clicks, hovers, scrolls
- Session paths (e.g., Home → Product → Checkout)
📌 Goal: Understand user behavior and intent.
Sensors
Sensors collect physical world signals and convert them into data.
Examples:
- IoT temperature sensors in smart homes
- GPS sensors in phones or delivery vehicles
- Accelerometers in fitness trackers
📌 Goal: Capture real-time data from the physical environment.
User-Generated Content
This is any content that users make themselves, either actively or passively.
Examples:
- Product reviews or ratings
- Uploaded photos or videos
- Social media comments
📌 Goal: Leverage user input for insights, personalization, or community building.
Move / Store
The Move/Store stage of the Data Hierarchy of Needs is all about getting the data from its source to where it can be used — reliably, at scale, and efficiently.
Here's what each part means:
Reliable Data Flow
This ensures that data moves consistently and accurately from one system to another without loss, duplication, or delay.
Examples:
- Streaming events from Kafka to a data warehouse
- Replaying missed events without data corruption
- Acknowledging successful ingestion to prevent reprocessing
📌 Goal: Trust that your data is flowing smoothly and predictably.
Infrastructure
Infrastructure includes the compute, storage, and networking resources that support data movement and storage.
Examples:
- Cloud VMs or serverless compute (e.g., AWS Lambda, GCP Dataflow)
- Object storage systems like S3, and data warehouses like BigQuery
📌 Goal: Provide the foundation for scalable and secure data systems.
Pipelines
Pipelines are automated systems that move and transform data from source to destination in a defined sequence.
Examples:
- An ingestion pipeline that moves data from APIs to a database
- A transformation pipeline that cleans and joins datasets daily
- Real-time pipelines using tools like Kafka, Flink, or Spark
📌 Goal: Automate reliable and repeatable data movement and processing.
ETL (Extract, Transform, Load)
ETL refers to the process of extracting data, cleaning or transforming it, and loading it into a final system like a warehouse or database.
- Extract: Pull raw data from sources
- Transform: Clean, format, join, or enrich data
- Load: Store the final dataset where it can be queried or used
📌 Goal: Prepare data for consumption by analytics, ML, or applications.
Data Storage
This is where data lives long-term, structured in a way that it can be easily accessed, queried, or analyzed.
Examples:
- Cloud object storage: AWS S3, GCP Cloud Storage
- Data warehouses: Snowflake, BigQuery, Redshift
- Data lakes: Delta Lake, Apache Hudi
- Databases: PostgreSQL, MySQL, MongoDB
📌 Goal: Store data cost-effectively while ensuring durability and accessibility.
Explore / Transform
The Explore and Transform stage of the Data Hierarchy of Needs is where raw data is shaped into something useful for analysis or modeling. Here's a breakdown of the three components you mentioned:
Cleaning
This is about removing errors and inconsistencies from raw data to make it usable.
Examples:
- Handling missing values (e.g., filling, dropping, or imputing)
- Removing duplicates
- Fixing typos or inconsistent formatting (e.g., NY vs. New York)
- Normalizing units (e.g., converting kg to lbs)
- Removing out-of-range or nonsensical values (e.g., negative age)
📌 Goal: Make the data trustworthy and consistent.
Preparation
This involves transforming clean data into a form suited for analysis or modeling.
Examples:
- Feature engineering (e.g., creating a new column age from
birth_date) - Encoding categorical variables (e.g., one-hot encoding country)
- Aggregating data (e.g., average sales per region)
- Joining datasets
- Converting timestamps to time-based features (e.g., extracting hour, day)
📌 Goal: Reshape data to match your downstream tasks (analytics, ML, etc.).
Anomaly Detection
This is the process of identifying unexpected, unusual, or suspicious data points that could indicate errors or rare events.
Examples:
- Detecting sensor spikes or dropouts
- Finding sudden changes in user behavior
- Catching fraudulent transactions
- Identifying system malfunctions from log data
📌 Goal: Spot and address data quality issues or operational anomalies before they affect insights or models.
Aggregate / Label
The Aggregate & Label stage of the Data Hierarchy of Needs is about creating summarized, structured, and labeled data that supports analysis, ML, and business insights. Let’s break down each term:
Analytics
This is the process of examining data to draw insights, usually through queries, reports, and dashboards.
Examples:
- “What were last month’s top-selling products?”
- “How many users churned in Q4?”
- “Which regions saw a drop in revenue?”
📌 Goal: Support business decisions with summarized views of data.
Metrics
Metrics are quantifiable measurements used to track performance over time.
Examples:
- Conversion rate
- Monthly active users (MAU)
- Average order value (AOV)
- Customer retention rate
📌 Goal: Provide standardized KPIs (Key Performance Indicators) that align teams.
Segments
Segments are subsets of data grouped by shared characteristics.
Examples:
- Users who bought more than $500 in the last 30 days
- Customers from urban areas
- Sessions that lasted longer than 10 minutes
📌 Goal: Enable targeted analysis, personalization, or experimentation.
Aggregates
Aggregates are summarized data values computed from raw data, often using functions like sum(), avg(), count(), etc.
Examples:
- Total revenue per day
- Average time on site per user
- Number of purchases per product category
📌 Goal: Reduce data volume and highlight meaningful patterns.
Features
In machine learning, features are input variables used to train a model.
Examples:
- User’s average purchase frequency
- Total login count in the past 7 days
- Text embeddings from product descriptions
📌 Goal: Create informative variables that help ML models make predictions.
Training Data
This is labeled data used to train machine learning models.
Examples:
- Emails labeled as spam or not spam
- Product images labeled with categories
- Customer sessions labeled as conversion or no conversion
📌 Goal: Provide examples of correct behavior for supervised learning.
Learn / Optimize
The Learn/Optimize stage in the Data Hierarchy of Needs is the pinnacle — it's where data actually drives decisions or automation through learning, experimentation, and predictive models.
A/B Testing
A/B testing is a method of comparing two or more versions of something (like a web page or product feature) to see which performs better.
How it works: Split users into groups → Show each group a different version (A or B) → Measure outcomes (e.g., clicks, purchases).
Purpose: Understand which version leads to better results using data-driven evidence.
📌 Think of it as controlled experimentation to validate ideas.
Experimentation
A broader concept than A/B testing, experimentation includes testing changes or ideas under controlled conditions to learn causal effects.
Examples:
- Multivariate testing (testing more than two versions)
- Holdout groups for comparing against a baseline
- Business process changes (e.g., pricing, UI changes)
📌 Goal: Use experiments to explore how changes impact behavior or outcomes.
Classical Machine Learning (ML)
This includes well-established algorithms that learn patterns from data to make predictions or decisions.
Examples:
- Linear regression, decision trees, random forests, SVM's
- Used in fraud detection, churn prediction, demand forecasting
📌 Used when the data and problem are well-structured and interpretable.
Artificial Intelligence (AI)
AI is a broader field focused on building systems that can perform tasks that usually require human intelligence.
Examples:
- Chatbots, recommendation engines, voice assistants
- AI includes ML, but also covers symbolic systems, planning, and reasoning.
📌 Goal: Build intelligent systems that can perceive, reason, and act.
Deep Learning (DL)
Deep Learning is a subset of ML based on neural networks with many layers, designed to learn complex representations of data.
Examples:
- Image classification, speech recognition, natural language processing (e.g., ChatGPT)
- Technologies: TensorFlow, PyTorch
📌 Used when the problem is too complex for classical ML and massive data is available.
What's the focus for Data Engineer?
So, even though almost everyone is focused on AI/ML applications, a strong Data Engineering Team should provide them with a infrastructure that has:
- Instrumentation, Logging, Support a Variety of Data Sources.
- Reliable Data Flow, Cleaning.
- Monitoring & Useful Metrics.
These are really simple things, but they can be really hard to implement in complex systems. 🤭
As an engineer, we work under constraints. We must optimize along these axes:
- Cost - How much money it takes to build, run, and maintain something.
- Agility - How fast we can make changes, fix things, or try new ideas.
- Scalability - How well the system handles more work or more users without breaking.
- Simplicity - How easy it is to understand, use, and maintain the system.
- Reuse - How often we can use the same code, data, or design in different places.
- Interoperability - How easily things work together, even if they’re from different teams, systems, or tools.
Data Maturity
Another great idea from this chapter is Data Maturity.
Data Maturity refers to the organization's advancement in utilizing, integrating, and maximizing data capabilities.
Data maturity isn’t determined solely by a company’s age or revenue; an early-stage startup may demonstrate higher data maturity than a century-old corporation with billions in annual revenue.
What truly matters is how effectively the company leverages data as a competitive advantage.
Let's understand this with some examples:
🍼 Low Data Maturity
Example: A small retail store writes sales down in a notebook.
- Data is scattered or not digital.
- No real insights, just raw facts.
- Decisions are made by gut feeling or experience.
🧒 Early Data Maturity
Example: A startup uses Excel to track customer data and email open rates.
- Data is digital but siloed (spread across tools).
- Some basic analysis is done manually.
- Decisions use data occasionally, not consistently.
🧑🎓 Growing Data Maturity
Example: A mid-sized company uses a dashboard to track user behavior and marketing ROI.
- Data is centralized in a data warehouse.
- Teams access metrics through BI tools.
- Data helps make better business decisions.
🧠 High Data Maturity
Example: An e-commerce company uses real-time data to personalize recommendations and detect fraud.
- Data flows automatically across systems.
- Teams experiment and optimize based on data.
- Machine learning is part of everyday operations.
🧙 Very High Data Maturity
Example: A global tech company automatically retrains ML models, predicts demand, and adjusts supply chain in real-time.
- Data is a core strategic asset.
- All decisions are data-driven.
- Innovation, automation, and experimentation are the norm.
How to become a Data Engineer ? 🥳
Data engineering is a rapidly growing field, but lacks a formal training path. Universities don't offer standardized programs, and while boot camps exist, a unified curriculum is missing.
People enter the field with diverse backgrounds, often transitioning from roles like software engineering or data analysis, and self-study is crucial. 🏂
A data engineer must master data management, technology tools, and understand the needs of data consumers like analysts and scientists.
Success in data engineering requires both technical expertise and a broader understanding of the business impact of data.
Business Responsibilities:
- Know how to communicate with nontechnical and technical people.
Example: You’re building a dashboard for the marketing team. You explain in simple terms how long it will take and ask them what insights matter most—without using technical jargon like “ETL pipelines” or “schema evolution.” Then you talk to your fellow engineers in detail about data modeling and infrastructure.
- Understand how to scope and gather business and product requirements.
Example: A product manager says, “We want to know why users drop off after sign-up.” You don’t just jump into building something—you ask follow-up questions: “What’s your definition of drop-off? Are we looking at mobile or web users? Over what time frame?”
- Understand the cultural foundations of Agile, DevOps, and DataOps.
Example: You don’t wait months to launch a data product. Instead, you release a small working version (MVP), get feedback from stakeholders, and iterate quickly. You write tests and automate your pipeline deployments using CI/CD like a software engineer.
- Control costs.
Example: Instead of running an expensive BigQuery job every hour, you optimize the SQL and reduce the schedule to once every 6 hours—saving the company hundreds or thousands of dollars a month in compute costs.
- Learn continuously.
Example: You hear your team wants to adopt Apache Iceberg. You’ve never used it, so you take an online course, read the docs, and build a mini project over the weekend to see how it works.
A successful data engineer always zooms out to understand the big picture and how to achieve outsized value for the business.
Technical Responsibilities:
Data engineers remain software engineers, in addition to their many other roles.
What languages should a data engineer know?
- SQL: lingua franca of data
- Python: Bridge between Data Engineering and Data Science.
- JVM languages such as Java and Scala: Crucial for open source data frameworks.
- bash: cli of Linux OS. Which is the leading operating system on servers (over 96.4% of the top one million web servers' operating systems are Linux.).
You can also add a CI/CD tool like Jenkins, containerization with Docker, and orchestration with Kubernetes to this list.
Data Engineers and Other Technical Roles
It is important to understand the technical stakeholders that you'll be working with.
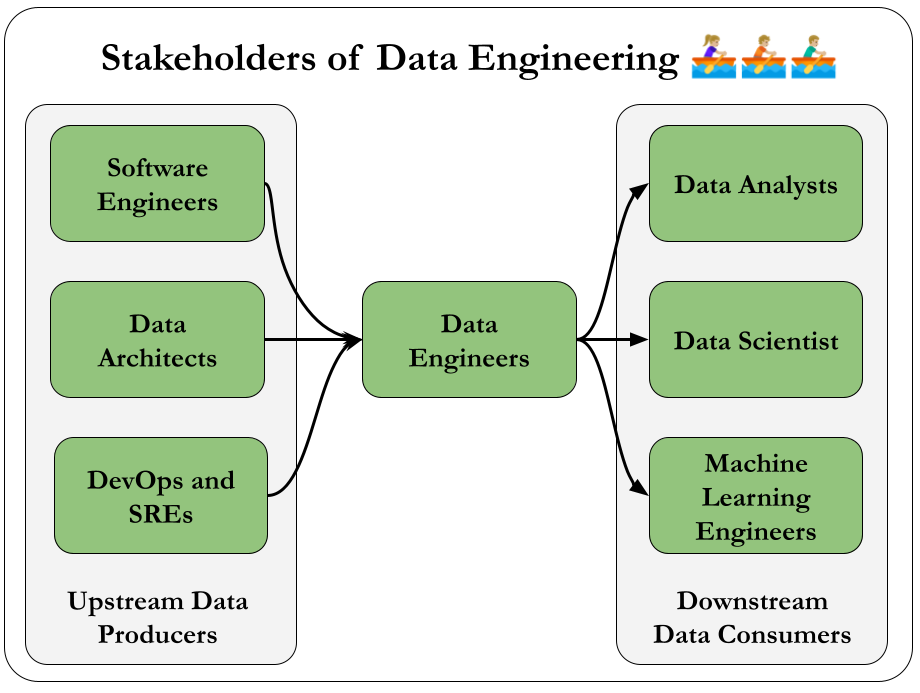
The crucial idea is that, you are a part of a bigger team. As a unit, you are trying to achieve something. 🏉
A great tactic would be to understand the workflows of those people which sits at the upstream or downstream of your work.
So feel free to research all technical roles with a prompt to an LLM like following:
As a Data Engineer a stakeholder of mine are Machine Learning Engineers. Can you help me understand what they do, how they do it and how's their work quality measured? I want to serve them in the best way possible.
Data Engineers and Leadership
Data engineers act as connectors within organizations, bridging business and data teams.
They now play a key role in strategic planning, helping align business goals with data initiatives and supporting data architects in driving data-centric projects.
Data in the C-Suite
C-level executives increasingly recognize data as a core asset.
The CEO typically partners with technical leaders on high-level data strategies without diving into technical specifics.
The CIO focuses on internal IT systems and often collaborates with data engineers on initiatives like cloud migrations and infrastructure planning.
The CTO handles external-facing technologies, working with data teams to integrate information from customer-facing platforms such as web and mobile applications.
The Chief Data Officer (CDO) oversees data strategy and governance, ensuring data delivers tangible business value.
There are other examples, but these are enough to demonstrate the value we bring as data engineers.
Conclusion
Now we know about:
- What is a Data Engineer and what does s/he do
- The Lifecycle they use
- The people they work with
Let's dive deep on the lifecycle. 🥳
🡐 Part 1 Overview